GazeHawk Team Joins Facebook

When we founded GazeHawk, we chose to attack a truly difficult computer vision challenge. Our team took a problem that many thought to be impossible — using ordinary webcams to determine where volunteers were looking on their computer screens — and turned it into a powerful product with real potential. While we’re still excited about the future of this technology, the time has come for us to move in a different direction.

While working on GazeHawk, we attracted the attention of the Facebook team, who were impressed with our ability to build out a powerful technology and platform. Likewise, we were impressed by the compelling story going on at Facebook today. As a result, we’re happy to announce that we will be joining the Facebook team. There’s a great culture at Facebook, focusing on fast, bold, innovative solutions, and we’re looking forward to being a part of it. We’ll be working on projects unrelated to GazeHawk, most likely on product and backend engineering.

GazeHawk’s product and technology are not part of the acquisition and will remain completely independent of Facebook. GazeHawk has developed a best-of-class technology that does not exist anywhere else, and is committed to seeing it continue to provide benefits to others. The team welcomes suggestions and thoughts on potential options at team@gazehawk.com.

A huge thanks to Y Combinator, our other investors, our advisors, and everyone we’ve worked with over the last two years. It’s been an amazing journey, and it wouldn’t have been possible without you!

– Brian & Joe

6 Comments

See us at the Digital West conference

Our co-founder, Joe, will be speaking at the AdAge Digital West conference in a few weeks. Be sure to stop by and say hi, and watch our presentation for an exciting announcement!

Tagged | Leave a comment

What else you should know about the human eye

We had an incredible response to our blog post on the human eye a few weeks ago; many commentators asked if we had a few more facts floating around that we could share. As it turns out, we do. Here are two more general findings from eye-tracking that everyone — designers, engineers, hackers in general — should know.

The “F-Shaped Pattern” for text oriented websites

A person browsing reddit with the F-shaped pattern

A few years ago, the eye-tracking world stumbled upon one of its most consistent results: people respond to text-heavy websites with an F-shaped heuristic. First, they look at the top-left of the website and read the first line of content text. Then, they scan the second line of text. Finally, they glance down the left column, reading a little of each line as they go. Users read much less text as they move down the page; a great summary of this behavior was written by Jakob Nielsen in a 2006 blog post.

This finding is probably familiar to anyone who’s studied usability; just image search “SERP eyetracking” for a few dozen heatmaps showing this effect on Search Engine Results Pages. However, it’s worth restating this pattern because it’s very robust. As we wrote about a few weeks ago, GazeHawk has found evidence that the first component of the F-pattern — shifting your eyes up and left towards the top of the screen — is almost universal across web pages: regardless of what web page you’re on, you probably look at the top-left of the site first.

What this means to you: Most of your users will only read the first few sentences on your page. Those sentences must have an impact.

Retinal acuity drops off fast

GazeHawk's Owen Byrne took this photo with a deliberately low depth of field.

In photography, a camera is said to have a high depth-of-field if the sharpness of the image drops off slowly as you look away from the focus of the camera. Like anything with a lens, the human eye has a depth-of-field (a particularly low one actually). Contrary to what you might think, our biology deliberately increases this effect, rather than trying to counter-balance it, by concentrating the distribution of cones in the center of the retina in a region called the fovea centralis. We really cannot see very well at the edges of our vision.

To a certain extent, the brain masks the severity of this effect from our conscious perception of the world. If you look out of the corner of your eye, the world doesn’t look warped or distorted. It just looks fuzzy. If you wanted to look at something specific, you’d just train your eyes on it. (The average duration of a saccade, the technical term for the rapid shifting of the gaze from one region to another, is about 200 ms. The eye is very good at rapid movement.) But the eye’s emphasis on looking at a specific focus and rapidly moving between foci has a price: we find it difficult to look at two things at once.

This finding is confirmed by eye tracking studies, which represent the focus of the human gaze with a single point. This approach wouldn’t work well if people paid a lot of attention to the parts of their vision outside their focus. Humans have binocular vision: both eyes are used together. This is opposed to monocular vision, found in prey animals, where the eyes move separately. If we eye tracked pigeons, we’d need two points to represent where they were looking.

What this means to you: People hate being forced to split their attention between multiple places on a page. Arrange pages so that elements related to a single task are close together.

That's it for this week. We have a few more articles on the horizon — we’ve been investigating how giving users a specific task affects their browsing habits when compared to ‘free’ browsing. However, we’d like some community input on the topic of our next few blog posts. If you could use eye tracking to study something, what would it be? What question would you want to answer?

Tagged , | 2 Comments

Relentlessly focus on your customers: test usability

Many tech firms pride themselves on listening to their customers and fine-tuning their product based on customer feedback. Startups in particular are known for relentlessly seeking ways to better match products with customers’ needs. Many other aspects of hacker culture, such as the emphasis on keeping development cycles short and making continuous small improvements to products, follow from this basic belief in customer feedback.

The benefit of focusing on customer feedback is clear: it grounds you in reality. By continuously fitting your product to your market, you avoid the ego associated with wedding yourself to the ultimate product or version release that will save the world. You’re constantly forced to check your premises. You’re boxed into a situation of incremental refinement.

Hackers know the power of incremental refinement; it’s why Netflix and Google are so popular. They didn’t have a grand, visionary idea. They did one thing, and every day they sought to do it a little better. They studied what their customers were doing and sought to make it easier.

Amazon is the best example of this. Before Amazon was the default site for online shopping, it won market share little by little by making it slightly easier and faster to shop there than at a competitor. Wired had a long article about the tricks they worked in to their site over the years. And it worked: a thousand small changes later, Amazon looks pretty good.

What’s the best way to adopt this model? How do you ingrain this attitude into your work from day one? Test usability. Test it often and at all stages of production. Constantly push yourself to make your website, application or service just a little bit more intuitive. The rest will follow.

I work for a company that does usability testing, so don’t listen to me. Listen to this guy:

“It’s worth trying very, very hard to make technology easy to use. Hackers are so used to computers that they have no idea how horrifying software seems to normal people. Stephen Hawking’s editor told him that every equation he included in his book would cut sales in half. When you work on making technology easier to use, you’re riding that curve up instead of down. A 10% improvement in ease of use doesn’t just increase your sales 10%. It’s more likely to double your sales.” -Paul Graham

Tagged , , | 1 Comment

Beyond heatmaps: visualizing eye tracking data

Eye tracking data is notoriously hard to represent visually. It’s dense, high dimensional, and can’t be compressed without losing important information. The industry standard graphic, a heatmap of the combined tracks of all participants in a study, does a good job representing the amount of attention each area of the page got. However, it has crippling disadvantages.

A heatmap only represents the distribution of interest on a page; it reveals nothing about the order in which participants looked at areas of the page. It represents all participants with a single graphic and gives no sense of the variability of the ways in which participants approached a page. Worst of all, it invites the reader to infer that all study participants had tracks more or less similar to that of the overall heatmap. This is completely wrong; in fact, it’s entirely possible that no single participant had a track remotely similar to that of the combined heatmap.

An eyetracking infographic that makes up for these disadvantages would make an excellent partner for a heatmap. Such an infographic would have three goals: it should tell a story – represent the order in which participants looked at areas on the screen – and this story should be as broadly representative as possible. One way or another, people examining eyetracking data are going to commit the fallacy of composition: they will assume that each individual participant’s track is similar to that of the study as a whole. This new infographic should strive to ensure that this assumption is correct, even though it is not logically valid.

The infographic we invented with these goals in mind is shown below, next to a heatmap generated from the same data. We’re calling it a transition graph, after the physics/CS concept.

To build these graphics, we first cluster the points together. Then, for each cluster, we draw an arrow to the cluster that study participants most frequently looked at after looking at the first cluster. Arrow width is proportional to this frequency.

Sometimes, these arrows form a clear path through the different parts of the image — the Apple Trailers page above is an example of this. In this case, the path is the most representative way to think about how users traverse the page. It isn’t necessarily true that all users looked at the page this way; however, this is the best single representation of the way they looked. Even if the arrows don’t form a clear path, the reader still gets a sense of how the areas of the site relate to each other over time. Eye tracking users who rely only on heatmaps neglect this aspect of the data at their own peril.

Below are transition graphs for three more GazeHawk studies, along with the accompanying heatmaps. We’d really like to hear from the community, particularly data visualization specialists, on what you think about this visualization.

How would you like to see this? How would you represent this?

Tagged , , , | 14 Comments

Where do users look first?

Where do your users look first? Most people running a web site have asked themselves this question at some point. It’s a good question to ask: capturing a user’s attention and steering him or her towards the important areas of a site is a critical function of website design, and an excellent way to do this is to make the most important aspect of your site also the most visually appealing. But before you ask, “where do my users look first?”, perhaps you should ask, “where do users look first in general?”

Browsing the Internet is a learned skill. At some point, we all learned the standard website designs, the most common of which puts navigational information on the top left of the site, while placing content in the center of the screen. At GazeHawk, we don’t think this is an accident: anyone who reads a Western language is used to starting to read in the upper-left corner of a page. In books, its where the page starts — on the web, it’s where you orient yourself. Most top websites follow some variant of this design, and this article is going to convince you that you should as well. If you want your site to be immediately intuitive to readers, you should put your navigational information and logo in the top left of the page because that is where users look first.

Below are heatmaps of the first 3 fixations of 500 people, selected randomly from GazeHawk’s entire database of eye tracking studies. (The eye jumps between discrete moments of focus called fixations about three times a second — you can read more about the mechanics of the eye here.) This is as close as a representative sample of websites as we could get [1]. The fixations go in order from left to right.

You can see a big GIF rotating between the first 9 fixations here. (Given that fixations are of variable duration, stretching this analysis beyond this is not viable.) Notice that people overwhelmingly start in the middle of the screen. This is a common finding in eye-tracking: when presented with a stimulus, people spend a third of a second staring at the middle of it before reacting [2]. But then look what happens: overwhelmingly, participants’ second fixation is above and to the left of their first, regardless of where their first fixation was. We can demonstrate this quantitatively: below are two histograms showing the angle in radians from the first fixation to second (blue) and fourth fixation to fifth (red).

For the blue histogram, the majority of movement is between 135 and 180 degrees — the upper left. The red histogram, which is broadly representative of all the others, is much more dispersed than the blue, indicating that more angles are popular. For the red histogram most popular angles are to the left and right of the current fixation, consistent with what we see when people are reading or skimming text. So to summarize our findings so far, almost every participant glanced up and to the left of their first fixation, and within a second of loading the page, most people were looking towards the upper-left.

To be sure that there isn’t some other explanation for this behavior, we also checked to make sure that these fixations were roughly the same distance from each other. The distribution of distance between fixations turns out to have a long tail, but its mean almost always stays between 200 and 250 pixels. The distribution does not change depending on which fixation we are examining or on the angle to the next fixation [3].

The conclusion we can draw from all this math is that overwhelmingly, people look at the top left of a website before moving on to other features. That’s where they expect navigational information to go; it’s where they expect to orient themselves. It’s also where you can capture their attention; and it’s where you should put your stuff.


Notes

1. The meaning of “representative sample of websites” is not clear. If we simply sample all domains on the Internet, the “representative sites” are probably spam or domain-sitting messages. If you weight by the popularity of a domain, then most websites are search engines or social networks. We think our sample is pretty good for what we’re trying to study.

2. As a 2007 paper from a team at UCSD put it, “In fact, simply using a Gaussian blob centered in the middle of the image as the saliency map produces excellent results.”

3. By Chi-squared test. Note that this is a little bit tricky — to some extent, the statistical blandness of distance between fixations is expected, because the eye rotates a variable-but-small amount between fixations (less than 20 degrees). However, we’re also a little worried that the consistency of distance between consecutive fixations might be due the dispersion-threshold algorithm we use to combine eye-tracking points into fixations.

Tagged , , | 13 Comments

Experienced users view Reddit differently

Everyone at GazeHawk loves reddit, so we decided to run a study tracking the eye movement of people looking at reddit. Here’s how it worked: we recorded the (x, y) coordinates of where our study participants looked while checking out reddit. We overlaid them onto a picture of the site, and then colored and blurred the points. The result is a heatmap, which graphically displays where participants looked. Below is part of the heatmap for a single person; click for the whole imshr.

As you can see, the coordinates of a person’s gaze tend to clump together. That’s because the eye doesn’t move continuously: rather, it jumps around (saccades in technical lingo) to different spots (fixations). You can read more quick facts about how the eye works at our last article. It seems this participant is spending most of his or her time reading the descriptions of links — the F-shaped pattern of the gaze is typical of someone in “reading mode”, and he or she doesn’t pay any attention to the background areas at all. We found this is typical of veteran redditors: they focus on the content they’re interested in, filtering out everything else.

Here’s a heatmap showing the combined interest of everyone who participated in the study; bright colors on a spot mean more people looked there.

It looks like people pay most attention to the top links and the bottom — there’s a space in the middle that gets less attention. Looking at the click-rates in our sample confirms this: links toward the bottom got clicked more frequently than those in the middle, but weren’t as popular as the top links.

But here’s a question: do people who use reddit all the time — the real addicts — look at reddit differently from people who have never seen it before? Here’s a side-by-side comparison of the two groups: new users on the left, veteran redditors on the right. As usual, click for the full-sized image. edit: A lot of people have asked for the definition of “veteran redditor.” For our purposes, a veteran was someone who reported visiting reddit more than once a week. A new user had never been on the site before.

Look at the differences for a moment. Veteran redditors barely paid any attention to the “welcome to reddit” header, whereas the new users stared at it for a long time. And while both groups became less likely to read a long link description as they scrolled down, the veterans lost focus much more quickly. It’s as if being on reddit for a while has made them jaded and shortened their attention span. Moreover, the average distance between the fixations of veteran redditors was smaller than it was for the new users — indicating that either only certain types of people become redditors, or that the veterans’ reading patterns had changed, becoming more similar to each other over their time on the site.

Now, I don’t want to get carried away with this analysis. When I joined GazeHawk, one of the first things I did was write an article about the dangers of inferring too much from heatmaps. With that said, this is great; using this sort of eye tracking tech, we can easily demonstrate that reading reddit is a skill that develops and changes over time. Odds are, visitors to your website change their habits with experience as well.

Tagged , , | 8 Comments

What everyone should know about the human eye

Odds are, you will one day build something someone will see. Here are three key findings from people who study how people see to keep in mind for your next project.

Eyes are not cameras

Cameras move slowly, smoothly and continuously. They pan, zoom and tilt. Eyes don’t do any of these things, and the first thing you need to know about the eye is that it is nothing at all like a camera.

The eye has two basic states: it can be in a fixation or a saccade. A fixation lasts between 200 and 400 ms and is characterized by a relative lack of eye movement.  A saccade is the brief, simultaneous movement of both eyes to a new fixation point. Saccades typically last less than 200 ms, in which time the eyes usually rotate less than 20 degrees. Very little information is retained or processed from the eye when in a saccade. (Saccades are pretty cool – if you’re interested, there’s been a lot of research on how the brain tricks itself into believing it receives a continuous feed of information from the alteration of saccades and fixations.)

What this means to you: Readers will navigate your website in a series of short glances followed by short hops. You need to keep related content close together, or it becomes a chore to navigate.

You don’t always see what you’re looking at

At GazeHawk, we refer to this as the ketchup-bottle problem after Brian‘s tendency to spend 10 minutes looking through the fridge for a bottle of ketchup that’s right in front of his face. Here’s the idea: your eyes are always on. But even when you want to be paying attention, your conscious mind cannot process the majority of the information the eyes are sending up. So you pick and choose what you want to pay attention to, and what you simply don’t see.

My favorite demonstration of this is the famous “selective attention test” a.k.a. the Monkey Business Experiment. For those not familiar with this, watch the video first.

The experimenter asked participants in the study to watch a video of two teams dribbling basketballs. The participants were instructed to count the number of times one team passed the ball. Unbeknownst to them, in the middle of the video a man dressed a in a gorilla suit walked into the shot, pounded his chest, and walked off. About half the study participants did not notice this happening.

It’s difficult to measure the extent to which this happens in daily life; after all, how do you know what you’re missing? And how do you design a web page knowing that people tend to miss things that are right in front of them? Keep it simple. If there’s only one thing on the page, it’s hard for them to miss it.

What this means to you: People can only absorb so much information at once. Do not expect them to “get” more than one thing at a time.

Faces, faces, faces

Humans love faces so much, sometimes we see them when they aren't there. Image from Wikipedia.

The brain comes pre-equipped with special processing centers for the detection, recognition, and processing of faces. While these systems develop as people age, infants as young as two months old have exhibited a preference to look at faces as opposed to other objects.

What does this mean for hackers? Human beings have an innate, insatiable urge to look at faces. If you put a picture of someone’s face on a website, almost everyone will look at it. If that face is near the top of the page, it is likely to be the first thing everyone looks at.

Here’s where it gets cool: not only do people love to look at faces, but we often use them as clues as to where else to look. Following a person’s gaze is almost a reflex. James Breeze demonstrated this really well in a blog post called “You look where they look.” His experiment was simple: about 100 people were shown a picture of an advertisement with a baby and some text. Half the time, the baby was facing the reader, while the other time, the baby was looking at the text. Breeze found that not only did the people shown the baby looking at the text pay more attention to the text, but they actually stopped looking at the baby faster in order to follow its gaze.

What this means to you: Be very careful when putting important visual cues or content near pictures of faces.

That’s it for this now. My next few posts may include more eye-tracking findings and a study of the eye movement of redditors.

Tagged , | 12 Comments

How do people look at Apple’s movie trailers page?

Apple Trailers

Apple Trailers just begs to be eye tracked.

Two weeks ago, we started an eye-tracking study of Apple’s iTunes movie trailers site. Originally, we had hoped to do a demographic breakdown of the study results — what posters did men like, what posters did women like, that sort of thing. However, the only statistically significant finding we were able to pull out was that people under 30 looked at Harry Potter ads longer than people over 30 — hardly groundbreaking. So we set at analyzing the data from the perspective of the posters themselves.

Does the poster matter at all?

Let’s build a naive model of how people look at the iTunes trailer site: assume that the content of the poster doesn’t matter, and that when moving from the top of the site to the bottom, people randomly decide to look at one of the 2-3 posters immediately below the one they’re currently staring at. Further assume that 15% of the time, people get bored and decide not to move on to the next row.

With just these assumptions, in each row you’d expect a distribution of views that looks like the familiar normal distribution: more eyeballs in the center than by the sides. You’d further expect this distribution to get more normal as you iterate down the rows. And guess what? You’d be right. Using these assumptions, we created a matrix giving the expected number of eyeballs hitting each poster. On average, the difference between the observed number of glances at a poster and the number our model predicted was about 1.7, out of an average of 8.2 glances per poster.

x = |Observed - Predicted|, n = 25

If that didn’t set off bells in your head, let me put it this way: you can assume the content of the posters doesn’t matter and still predict the overall distribution of glances with 80% accuracy. It’s as if the content of the posters doesn’t matter that much; instead their location on the page is almost everything. The location-based model fits, too: if it were systemically wrong, we would expect to see a non-random distribution of error. Instead, as the histogram shows, the error is distributed normally with a few outliers on the edges.

An aggregate heatmap of the whole study. Yes, everyone loves the big Harry Potter ad, but notice how little attention the far left side got.

Exceptions exist, but are hard to explain

So what were these outliers?  From a movie studio’s perspective, two were good: both Cowboys and Aliens and Kidnapped received significantly more views than expected, while Viva Riva! received significantly less. (Note that with 30 cells, at 95% confidence for statistical significance we expect one or two cells to be significant just by random chance.) It really isn’t clear why these posters varied so much from the others — this is exactly the sort of situation where explanations are easy to invent but hard to prove. I initially thought the simple silver-on-black scheme of Kidnapped’s poster drew a lot of attention because it provided people with a safe haven from the color and contrast of all the other posters. But this theory isn’t predictive: if it worked for Kidnapped, why didn’t it work for Pariah?

Moreover, it’s possible that the features that attract eyeballs to a particular poster are intensely context-dependent; a black poster like Kidnapped might attract attention when placed next to a colorful thing like Green Lantern, but not when paired with something grey like X-Men: First Class. We’d need to duplicate this study on randomized arrangements of the posters to get a good feel for this sort of thing.

So, how do people look at the Apple Trailers site? For the most part, randomly. They bounce around like pinballs in a Pachinko board, without any sense of direction or apparent purpose. In that situation, it’s incredibly difficult to reliably attract attention from your readers. If there’s a lesson to be learned from this study, that’s it: if you want to get your readers to look at something, don’t confuse them.

Tagged , , , | 6 Comments

Cluster analysis for concise results in eye tracking

Eye tracking data is received as a dense, high-entropy stream of coordinates.  This data is then redistributed using methods that will help display results and identify trends. The most common method we use for displaying results is a heatmap which illustrates study participant’s tracks. However, as we examined in our last post, aggregate heatmaps can be extremely deceptive if not carefully scrutinized. While it is important to comb the individual participant data,  this quickly becomes impractical with large studies. So what’s to be done?

One technique being considered is to cluster study participants and examine the aggregate heatmaps of these clusters, rather than the whole study. If we use a few different clustering metrics, we can identify different ways in which people looked around — effectively creating use profiles directly from the data.

When clustering, buyer beware

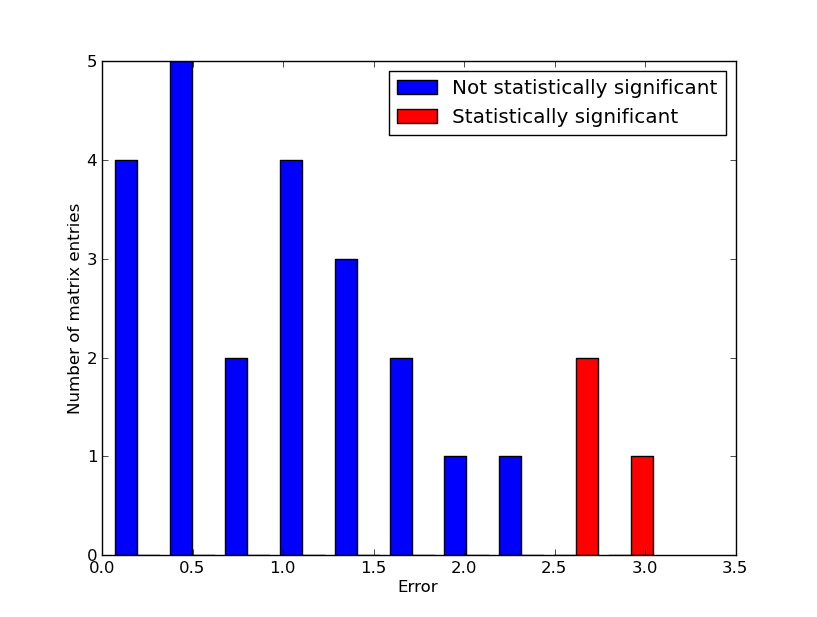
Before we dive into our results, remember that clustering algorithms always return a grouping, regardless of how meaningful that grouping is. The image below shows the results of a k-means clustering run on a bunch of coordinates in the plane.

Why use 9 clusters here?

At first glance, it looks like these results are reasonable. But ask yourself, why 9 clusters? Why not 8, 22, or 3? The drawback of many clustering algorithms is that while they always return something, it’s often difficult to determine how appropriate a particular clustering is. I don’t intend to elaborate too much on this point in this post — just be aware of it, and when you see a clustering in this post, ask yourself, does this look meaningful?

Clustering with box-counting distance

The first method we came up with for clustering eye tracks is box-counting clustering. It works like this: we divide the plane into an NxN grid of boxes. We mark each box as True if a point in the track fell into the box, and False if it didn’t. The distance between two tracks is the number of corresponding boxes they have with different boolean values; it’s a bit like figuring out the box-counting dimension of a fractal.

What’s cool about this technique is we can adjust N, the number of boxes on each axis, to get different distances:

  • For large N, each individual point is likely to be in its own box, in which case the total distance is equal to the sum of the number of points in both series.
  • For small N, everything tends toward a distance of 0.
  • We want an N that gives low distances for eye tracks with heatmaps that overlap significantly, but doesn’t simply lump everyone together.

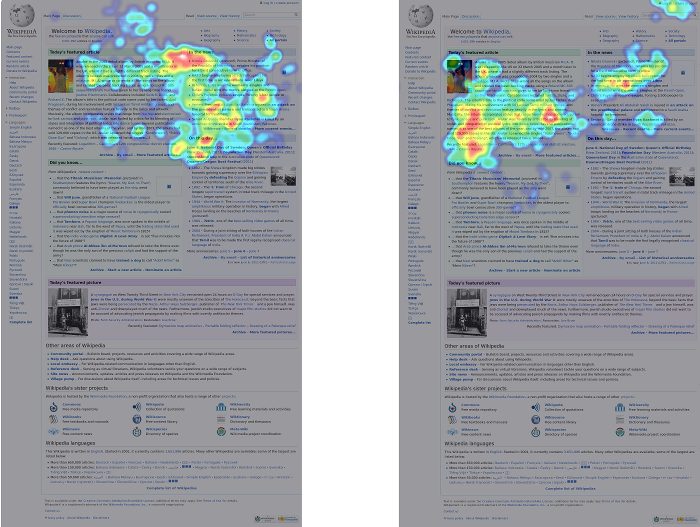
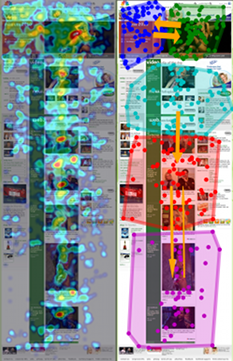
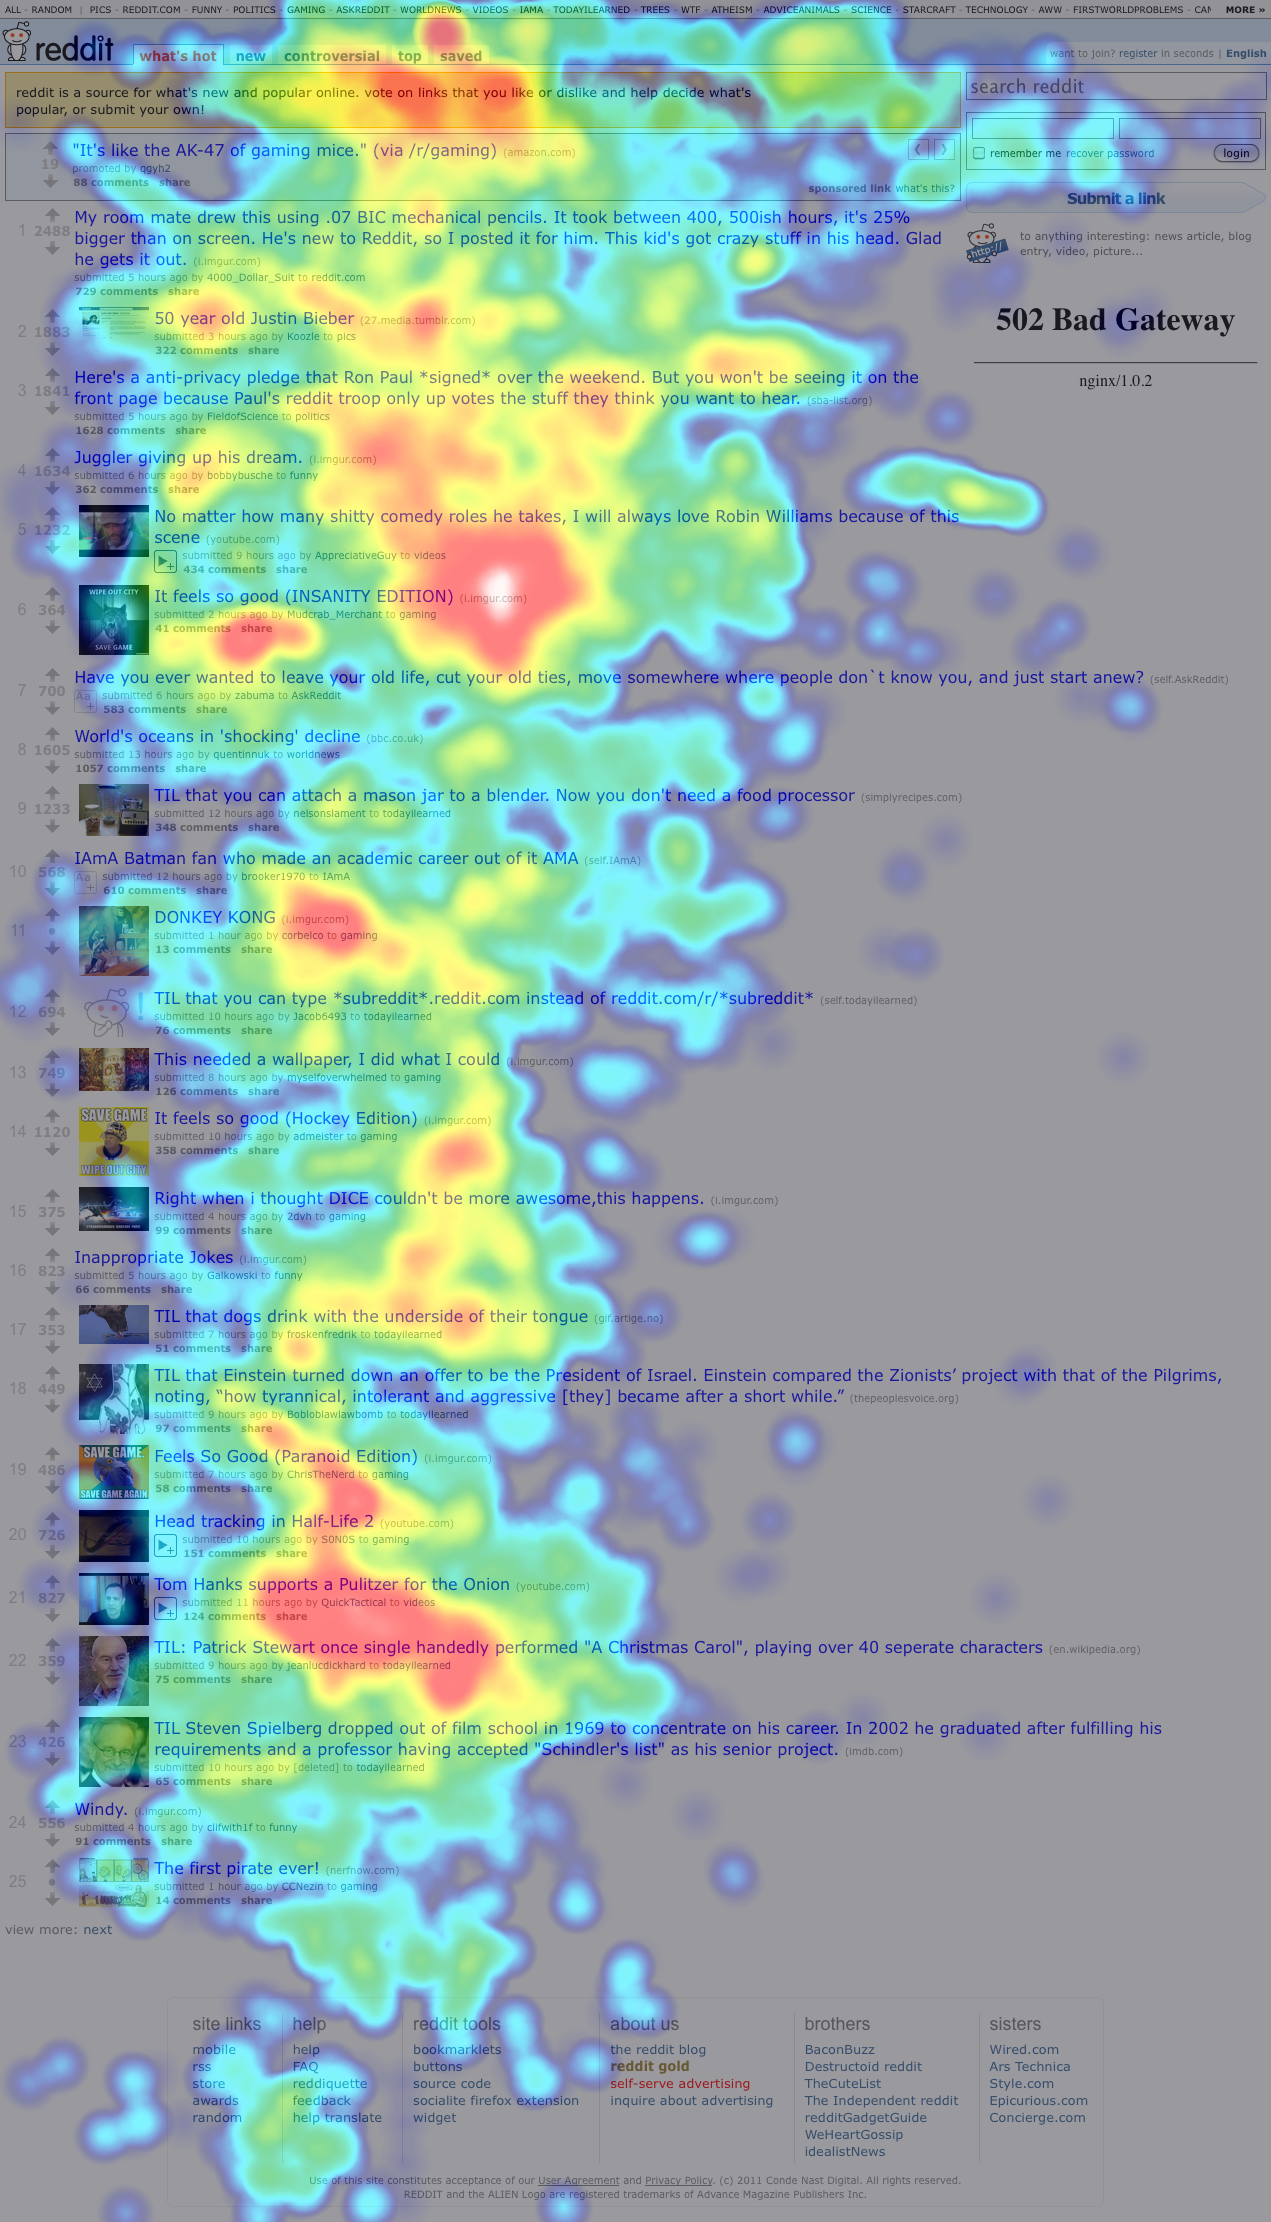
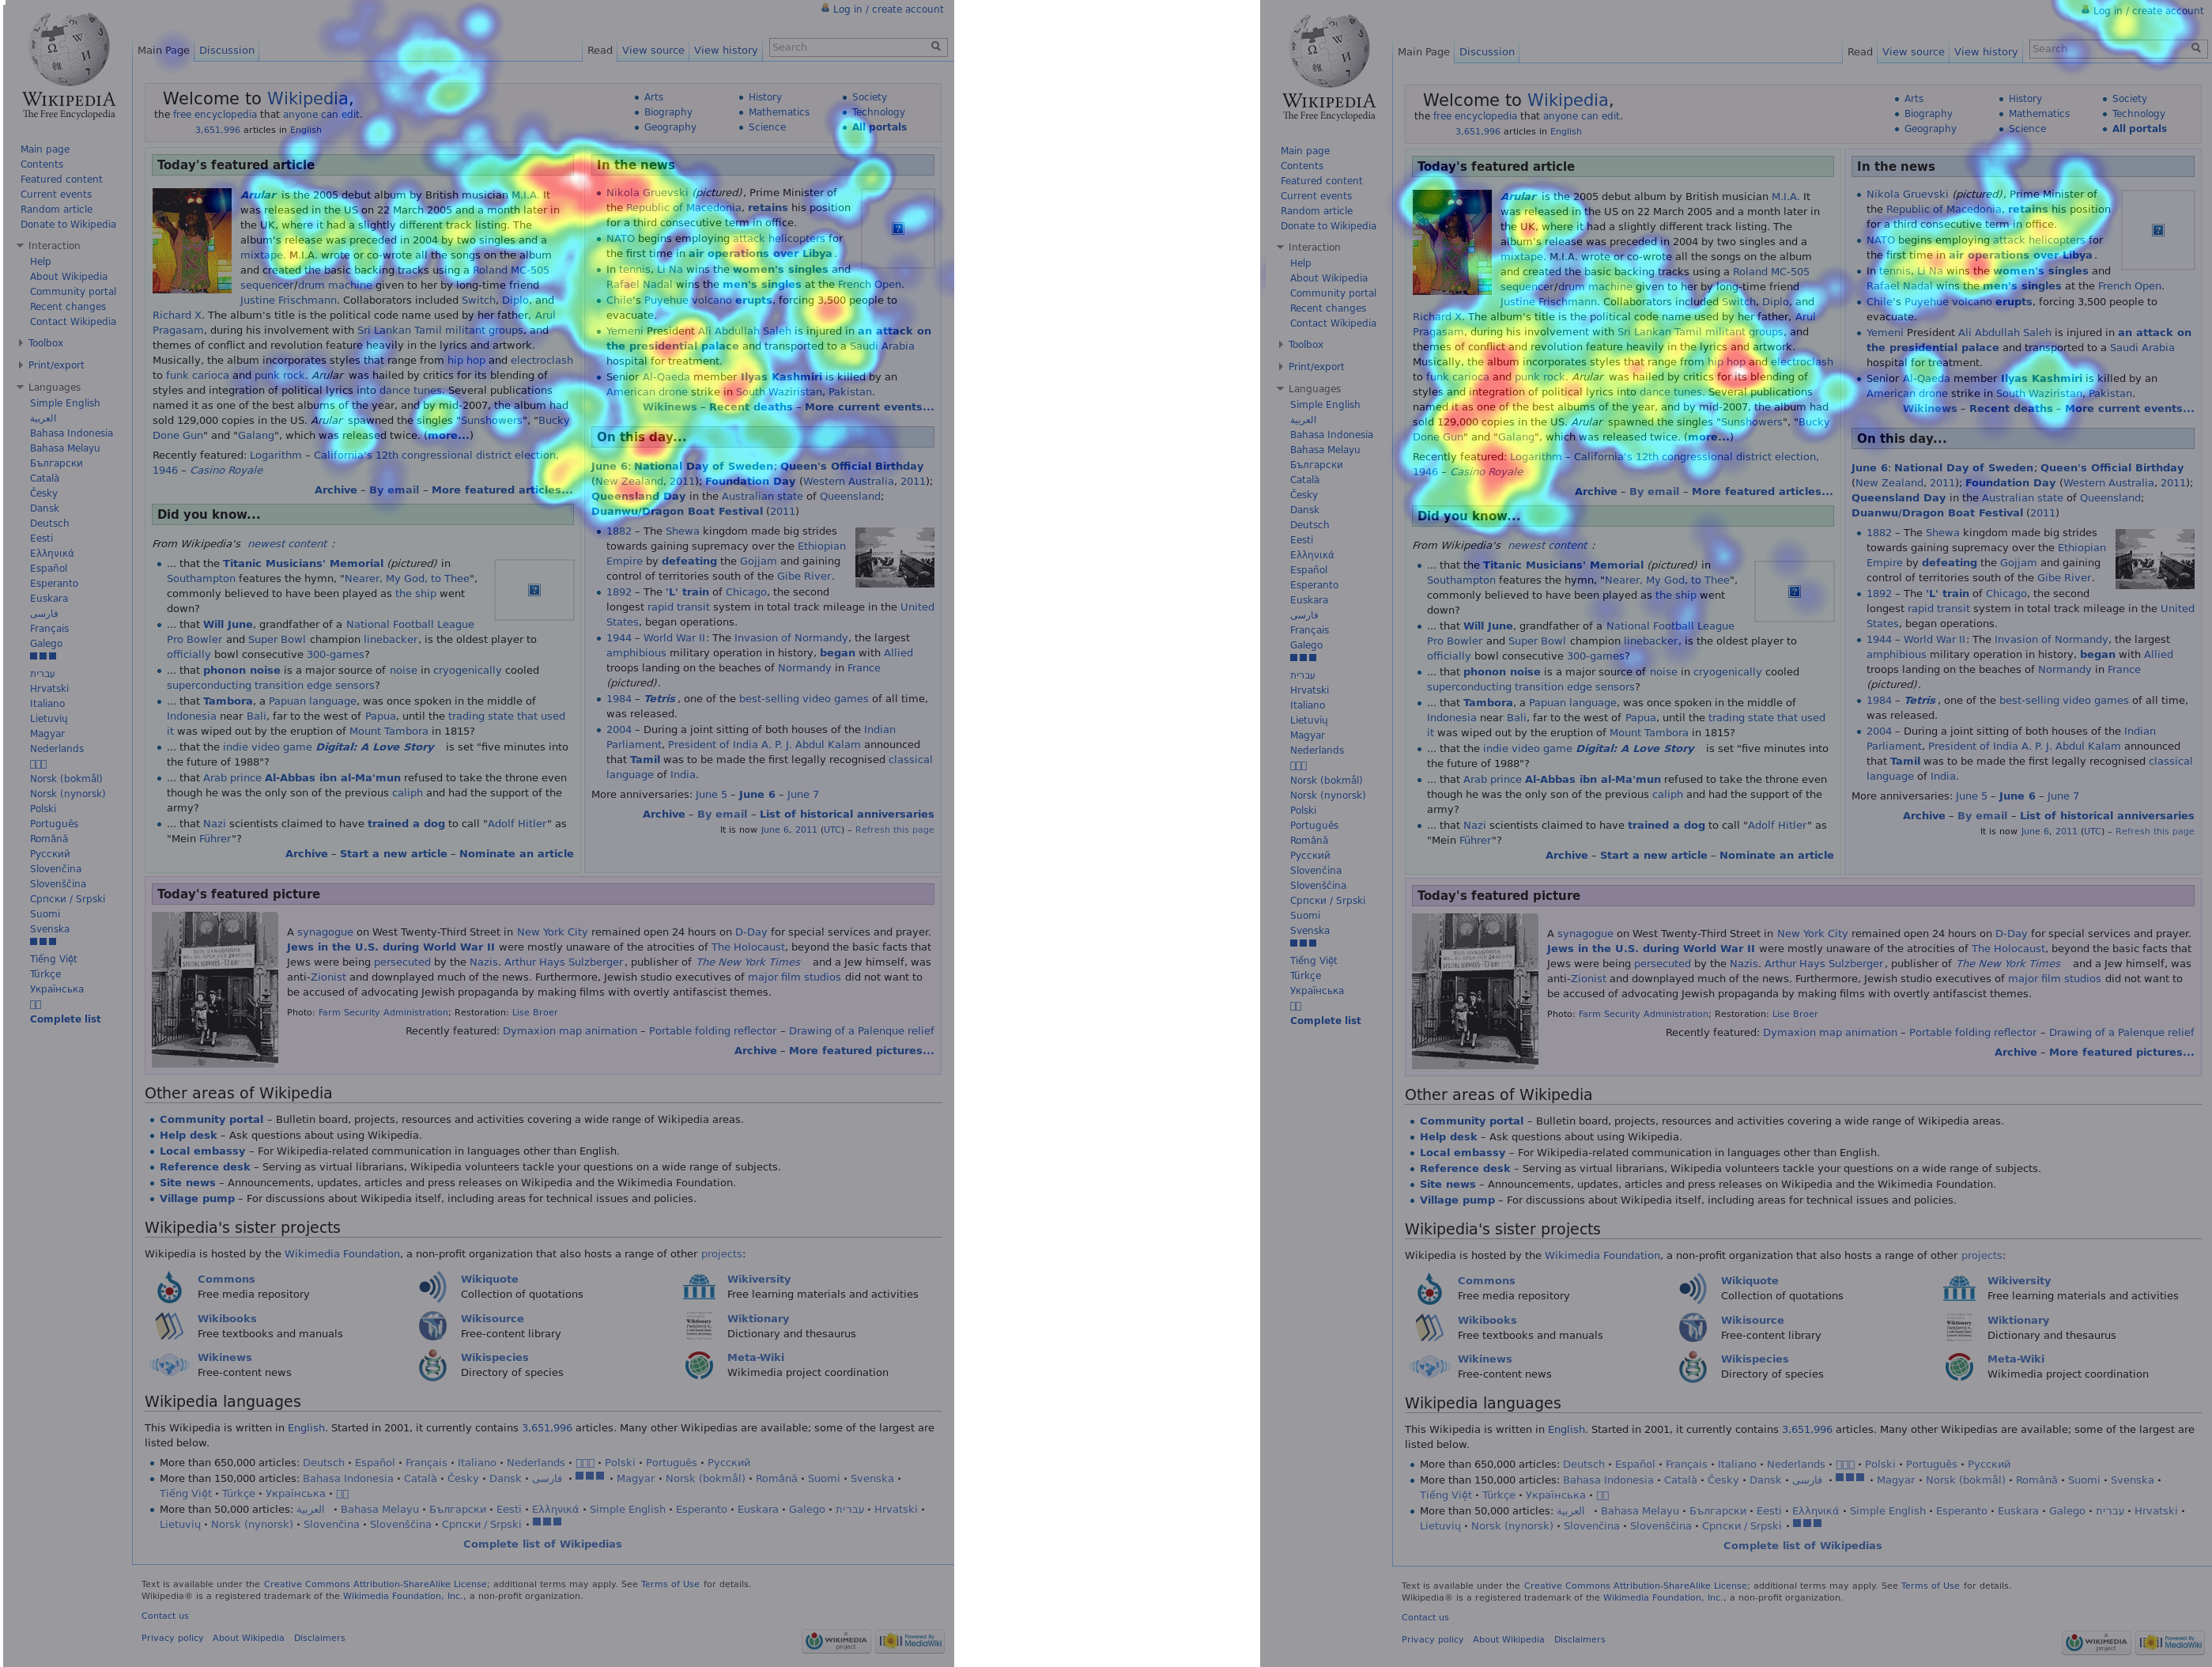
After playing around with this for a while, we found that 20 < N < 30 or so tends to give good results. Once we got our distances for each pair of eye tracks, we ran them through SciPy’s hierarchical clustering algorithm. Here’s a pair of clusters on a 9-participant Wikipedia study — remember that these are aggregate heatmaps and should not be trusted:

The overall idea seems to be that one group of people looked almost exclusively at the upper-right block of text and the featured article, while the other group looked around at other things. If we just looked at the combined heatmap, we would completely miss this distinction.

Clustering with Euclidian distance

Clustering with box-counting distance is visually intuitive because eye tracks with low box-counting distance have similar-looking heatmaps. However, it shares a weakness of heatmaps: it ignores the time at which participants looked at areas of a site and only considers where the participants looked. Since the temporal aspect of looking at a website is critical, we also cluster eye tracks with a time-sensitive model.

GazeHawk’s eye tracks are a series of coordinates that correspond with where each participant was looking at a particular time. Each track is scaled to roughly 30 coordinates per second of video, so we have a reasonably consistent amount of time between points across all eye tracks. For two tracks, then, our second measure of distance is the average distance between where participants were looking at a given time.

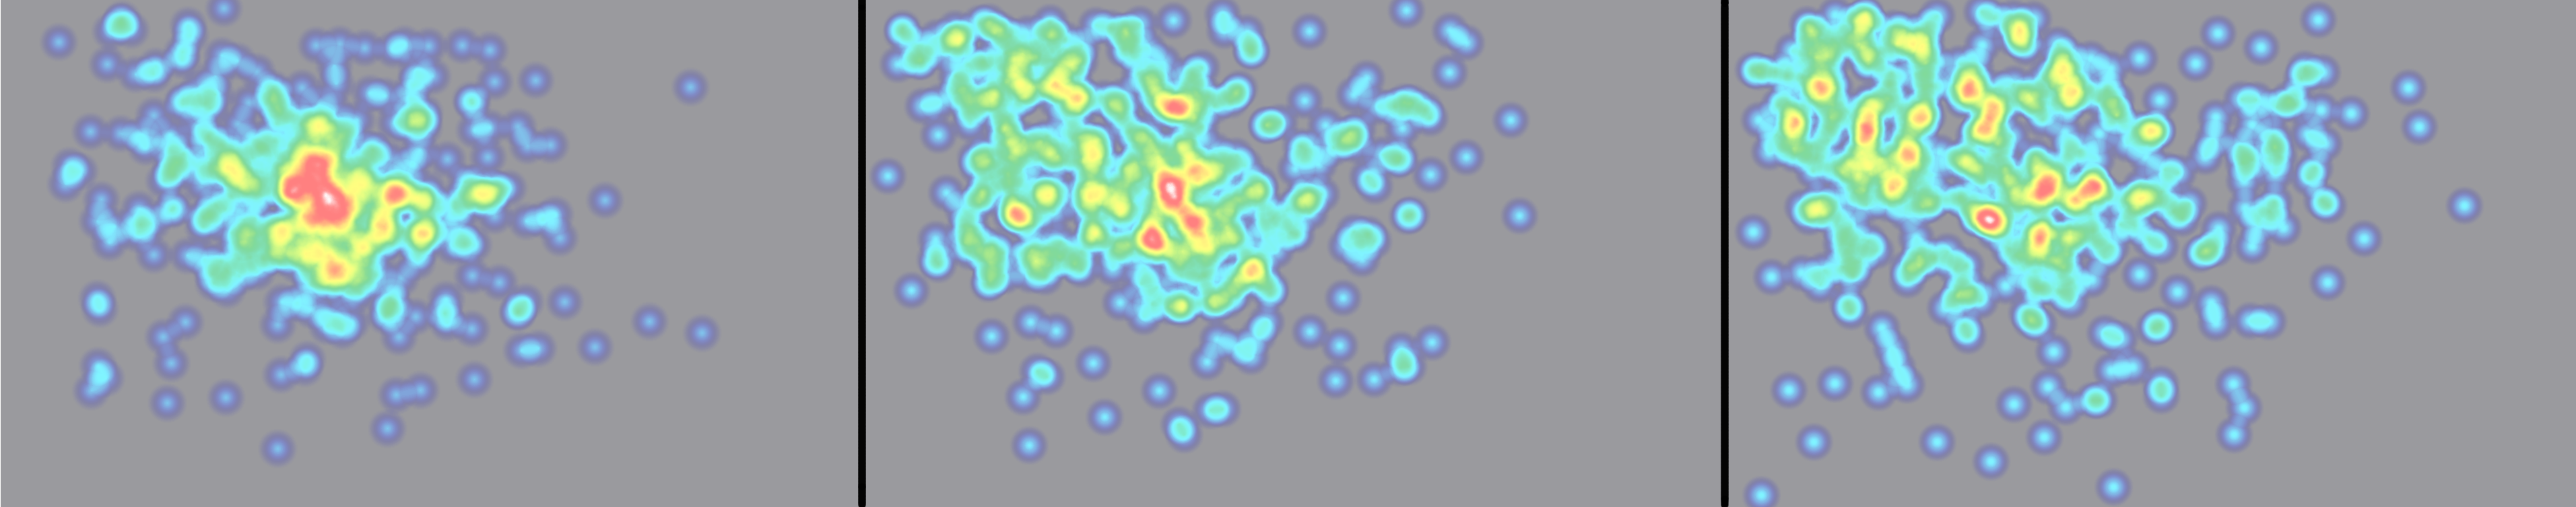
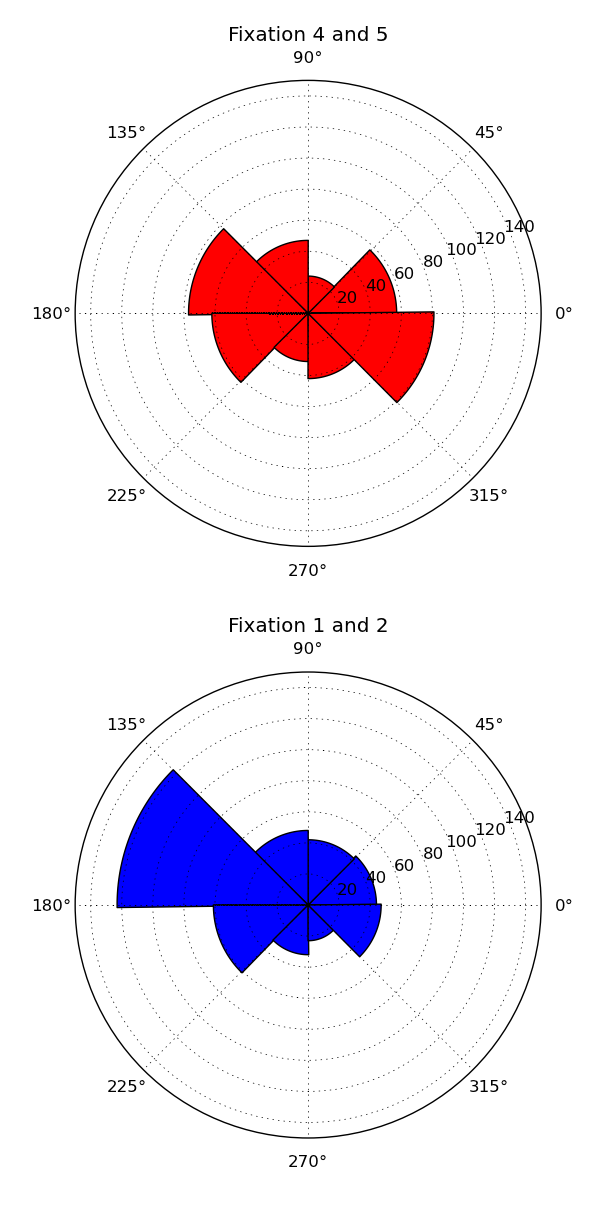
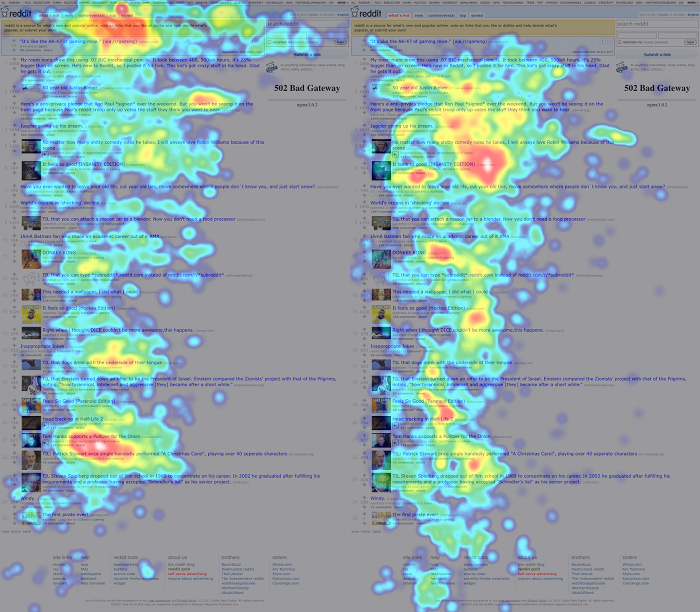
This distance measure works reasonably when the number of coordinates involved is low, but it breaks down when comparing thousand-coordinate tracks. So we use it on the most important set of coordinates: those that correspond with the user’s first few seconds on the site. The heatmaps below show the participants in the same Wikipedia study clustered using the first 300 coordinates (10 seconds) of their gaze tracks.

The distinction is pretty clear: participants in the first cluster looked at the right text box first, while participants in the second cluster look at the left box first.

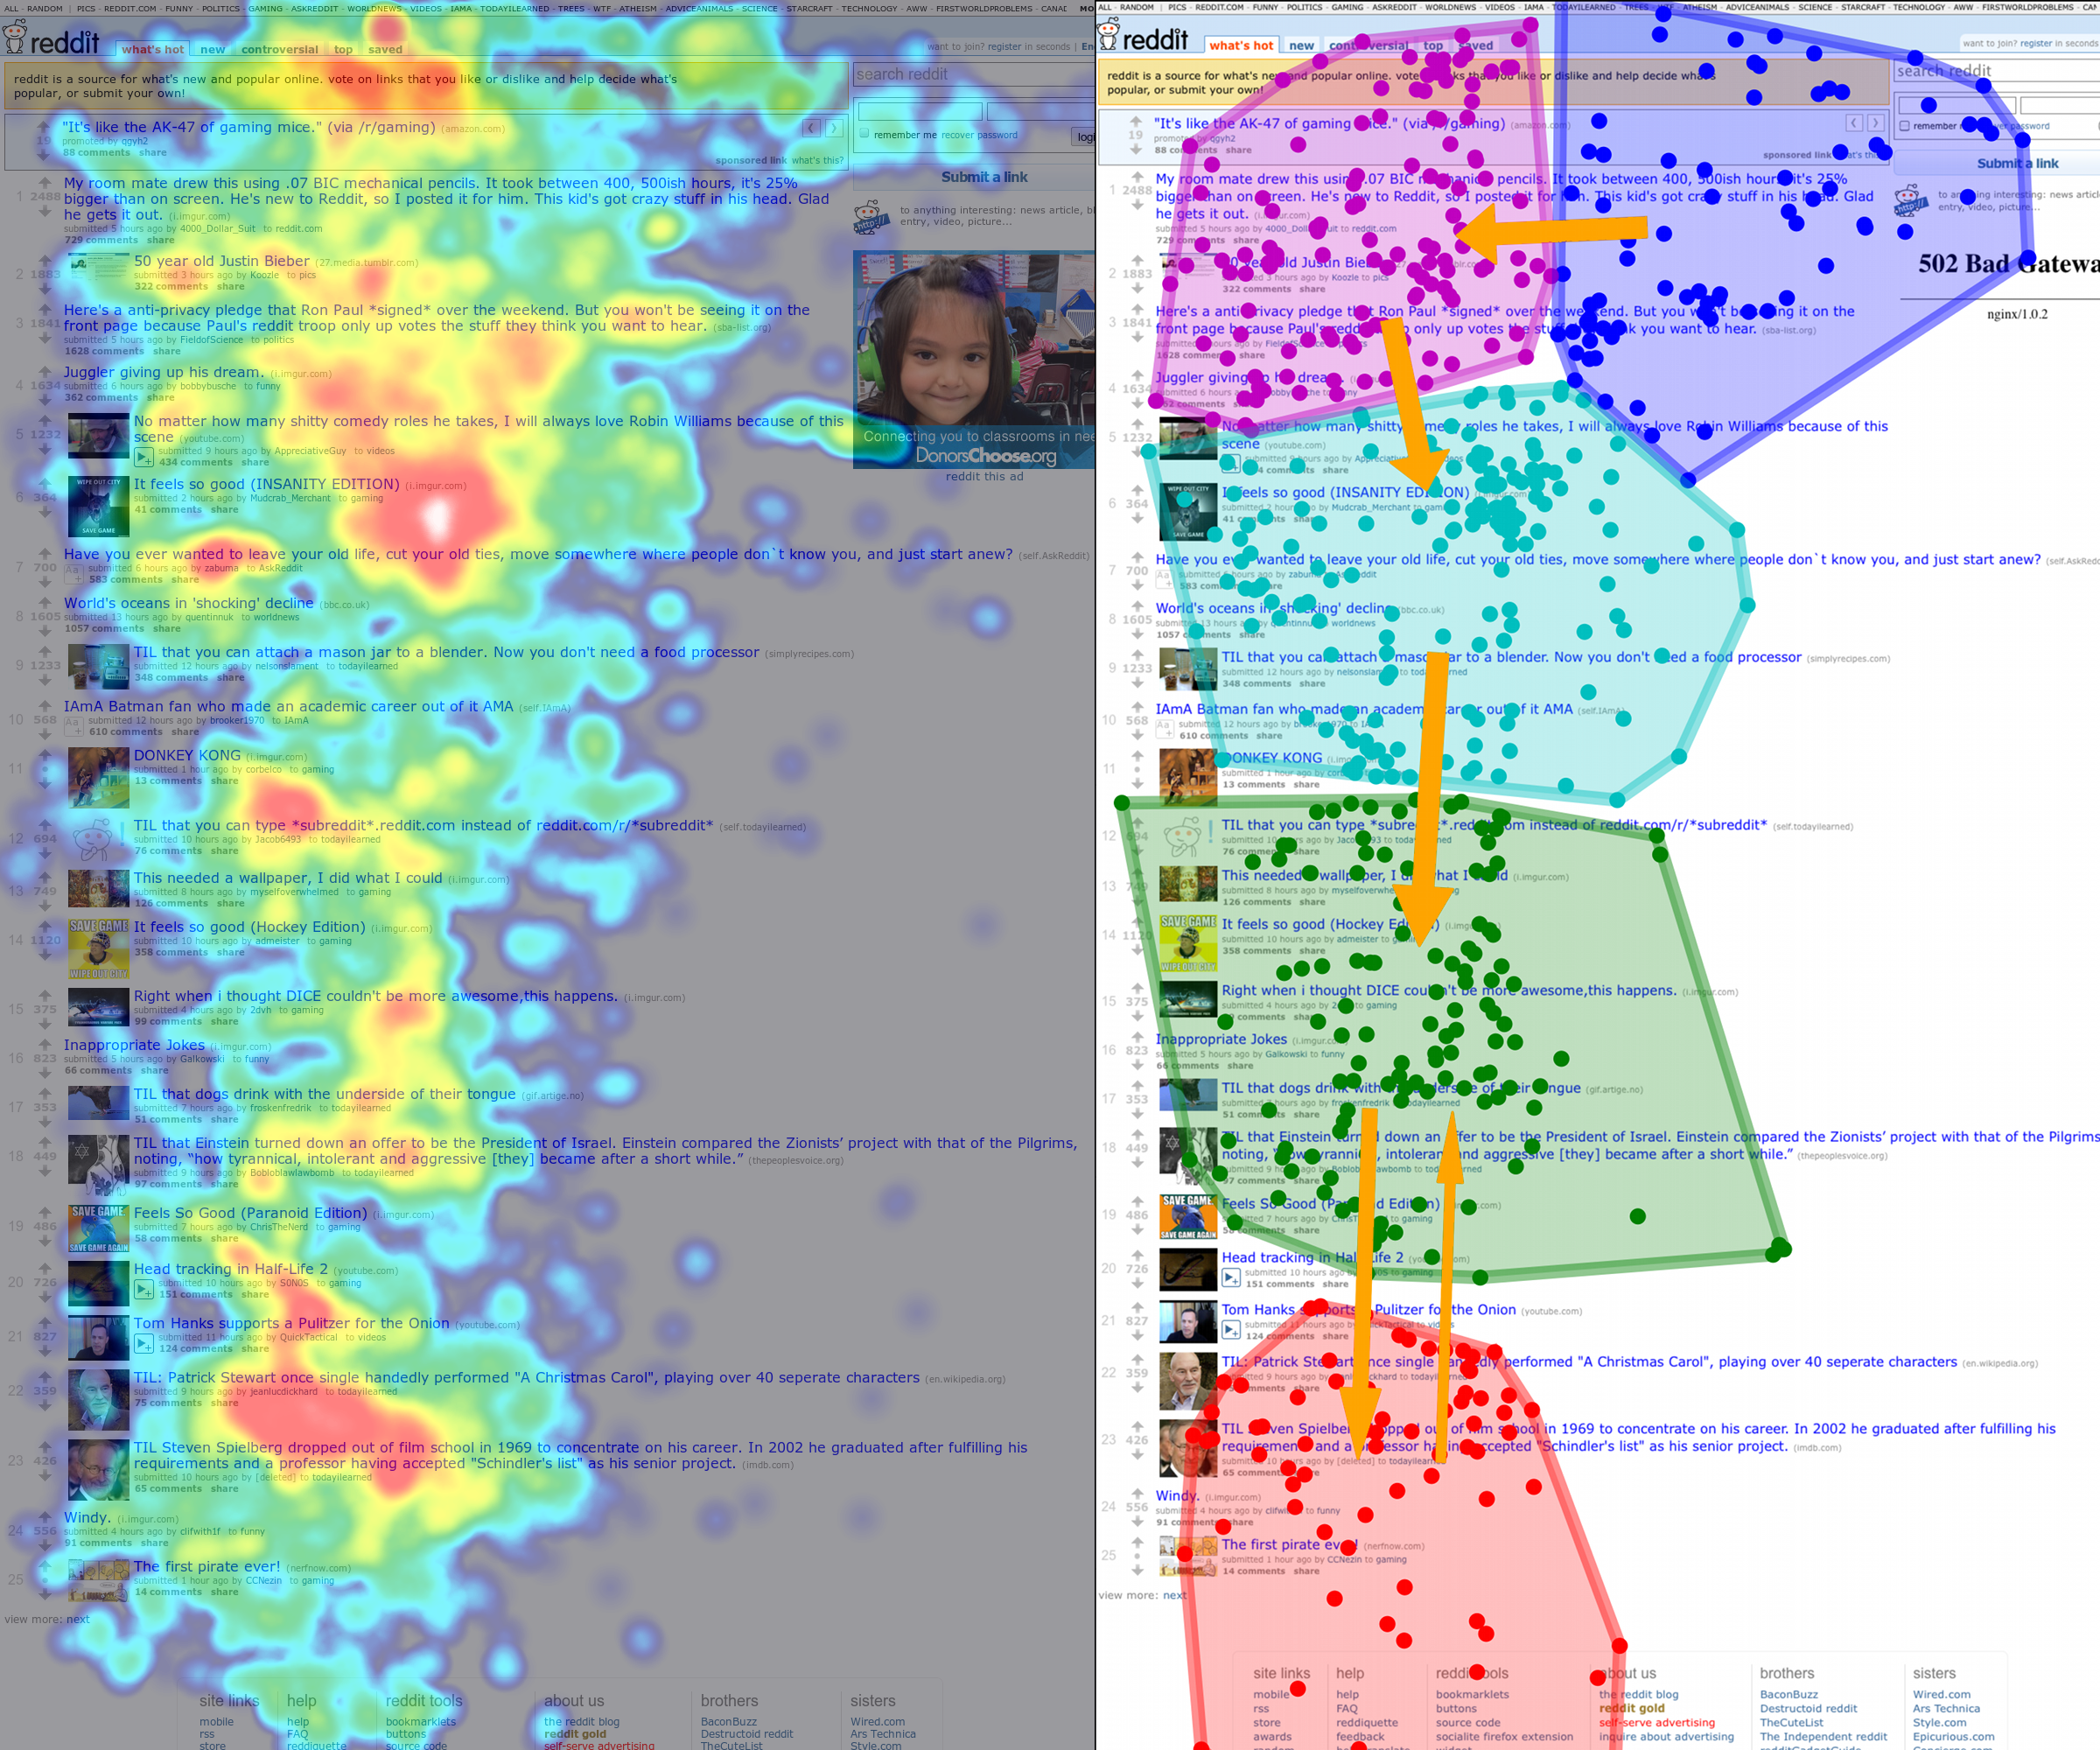
This may seem like a minor finding, but get this: the clusters generated by this distance metric and the box-counting metric above are identical. In other words, the people who looked at the “Featured Article” box first tended to stay in that area of the page, while the people who looked at “In The News” tended to then move on and look all over the page.

There’s no way to tell why this grouping happened. However, the fact that it persisted across multiple measures of similarity suggests that there really is something going on in these clusters. It also suggests that if we want to give our customers useful information about how people look at their websites, these four heatmaps might be sufficient on their own.

And that’s what this is all about: finding the clearest, most concise way to communicate our findings to customers.

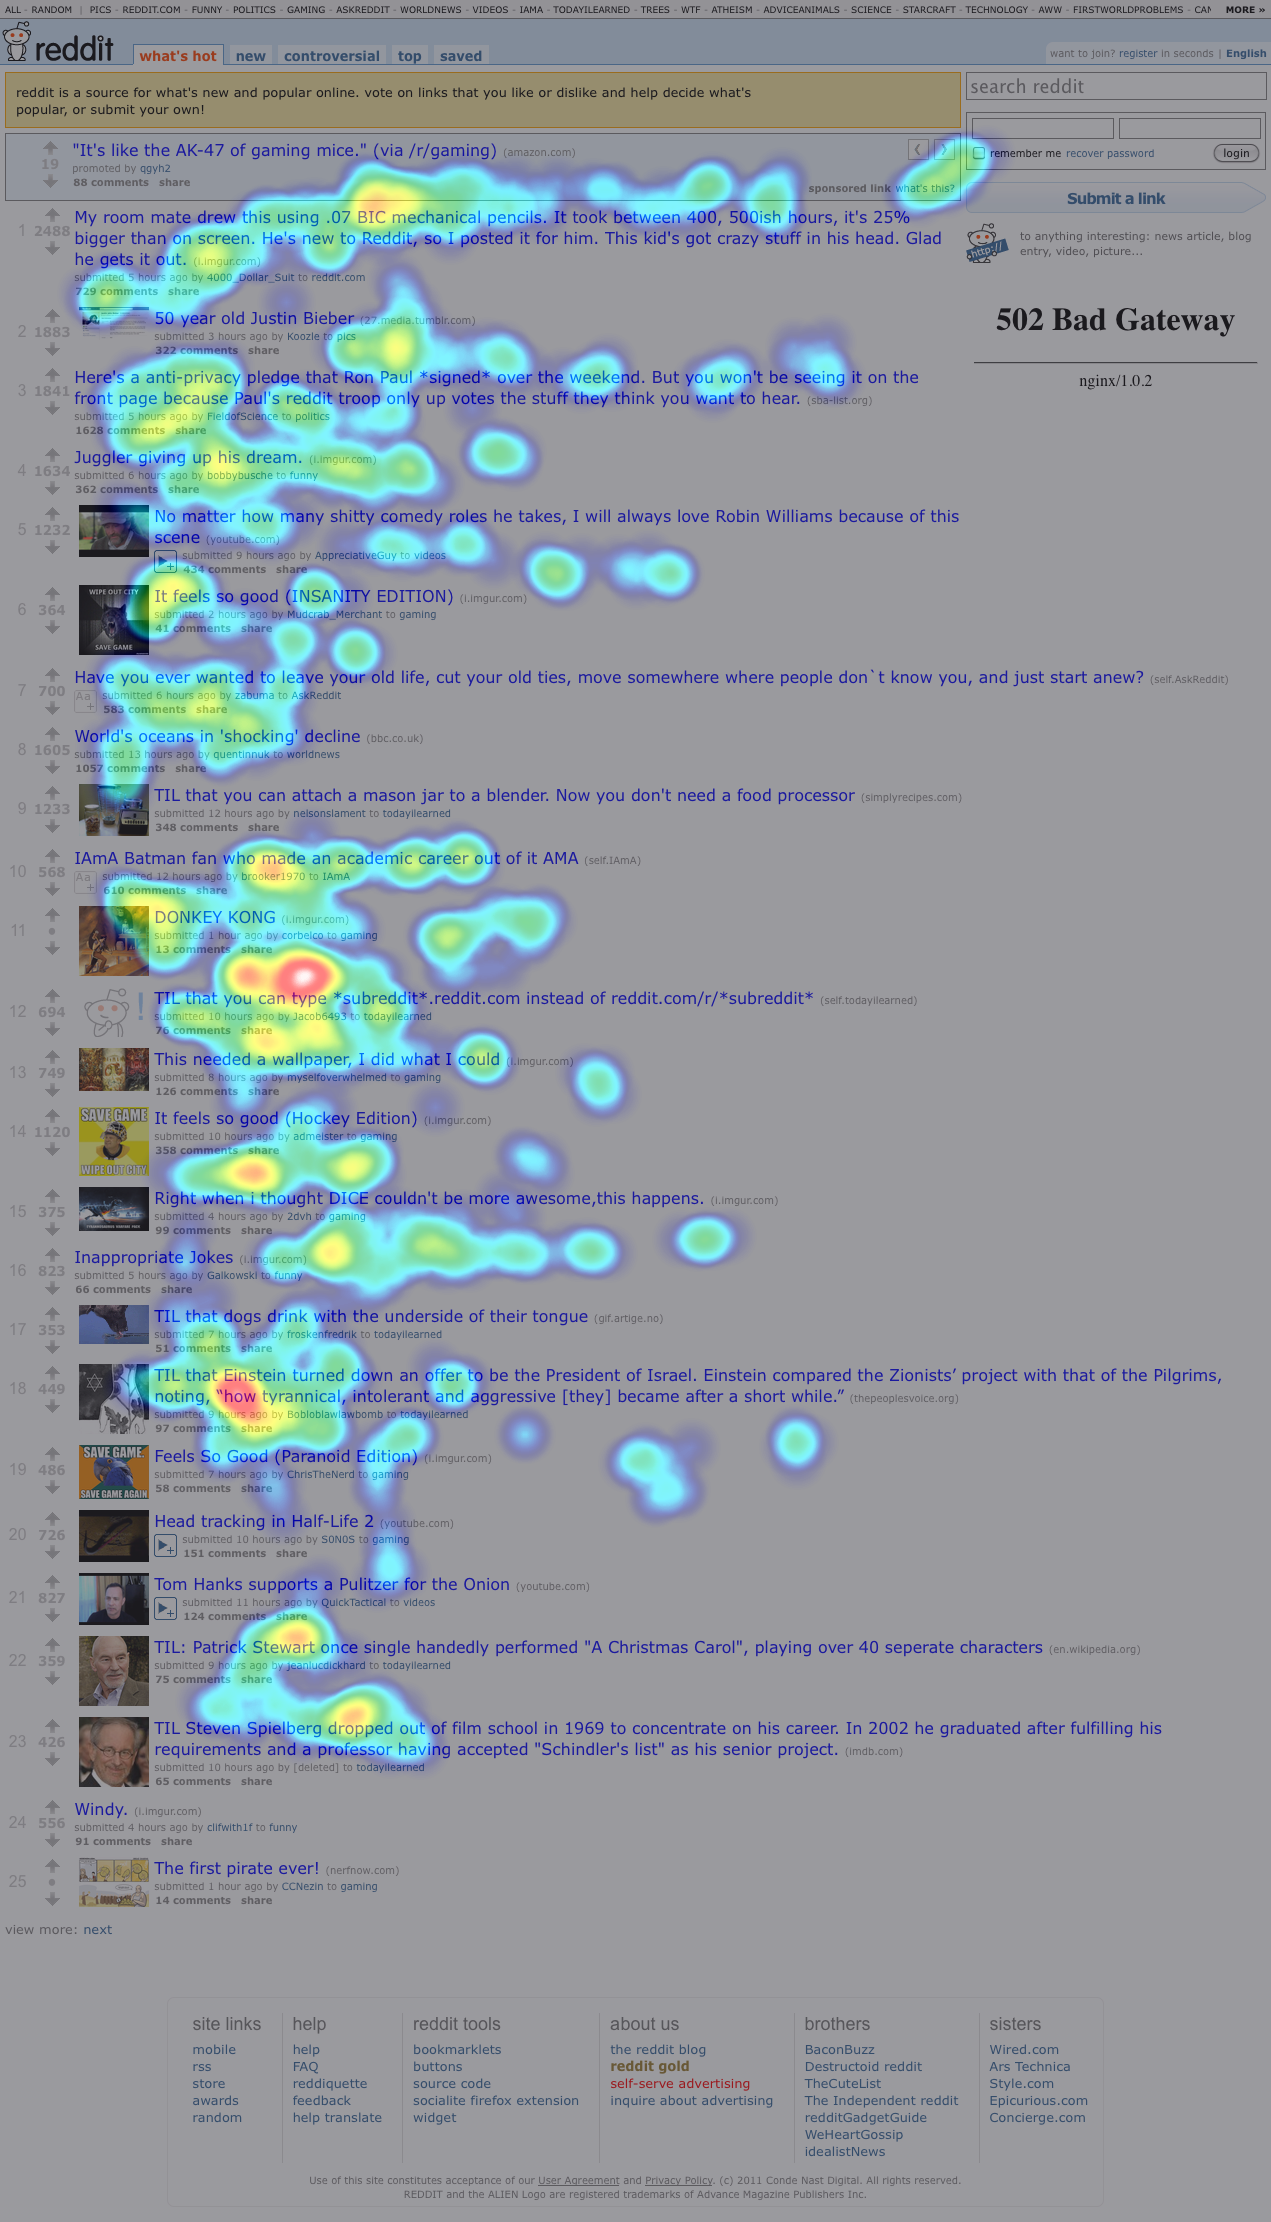
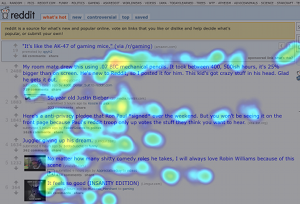
Next week, we’ll be examining how a person’s gaze changes based on whether or not they have seen a site before. The target of the study will be another popular site — reddit.com.

Tagged , , | Leave a comment