Eye tracking data is received as a dense, high-entropy stream of coordinates. This data is then redistributed using methods that will help display results and identify trends. The most common method we use for displaying results is a heatmap which illustrates study participant’s tracks. However, as we examined in our last post, aggregate heatmaps can be extremely deceptive if not carefully scrutinized. While it is important to comb the individual participant data, this quickly becomes impractical with large studies. So what’s to be done?
One technique being considered is to cluster study participants and examine the aggregate heatmaps of these clusters, rather than the whole study. If we use a few different clustering metrics, we can identify different ways in which people looked around — effectively creating use profiles directly from the data.
When clustering, buyer beware
Before we dive into our results, remember that clustering algorithms always return a grouping, regardless of how meaningful that grouping is. The image below shows the results of a k-means clustering run on a bunch of coordinates in the plane.
At first glance, it looks like these results are reasonable. But ask yourself, why 9 clusters? Why not 8, 22, or 3? The drawback of many clustering algorithms is that while they always return something, it’s often difficult to determine how appropriate a particular clustering is. I don’t intend to elaborate too much on this point in this post — just be aware of it, and when you see a clustering in this post, ask yourself, does this look meaningful?
Clustering with box-counting distance
The first method we came up with for clustering eye tracks is box-counting clustering. It works like this: we divide the plane into an NxN grid of boxes. We mark each box as True if a point in the track fell into the box, and False if it didn’t. The distance between two tracks is the number of corresponding boxes they have with different boolean values; it’s a bit like figuring out the box-counting dimension of a fractal.
What’s cool about this technique is we can adjust N, the number of boxes on each axis, to get different distances:
- For large N, each individual point is likely to be in its own box, in which case the total distance is equal to the sum of the number of points in both series.
- For small N, everything tends toward a distance of 0.
- We want an N that gives low distances for eye tracks with heatmaps that overlap significantly, but doesn’t simply lump everyone together.
After playing around with this for a while, we found that 20 < N < 30 or so tends to give good results. Once we got our distances for each pair of eye tracks, we ran them through SciPy’s hierarchical clustering algorithm. Here’s a pair of clusters on a 9-participant Wikipedia study — remember that these are aggregate heatmaps and should not be trusted:
The overall idea seems to be that one group of people looked almost exclusively at the upper-right block of text and the featured article, while the other group looked around at other things. If we just looked at the combined heatmap, we would completely miss this distinction.
Clustering with Euclidian distance
Clustering with box-counting distance is visually intuitive because eye tracks with low box-counting distance have similar-looking heatmaps. However, it shares a weakness of heatmaps: it ignores the time at which participants looked at areas of a site and only considers where the participants looked. Since the temporal aspect of looking at a website is critical, we also cluster eye tracks with a time-sensitive model.
GazeHawk’s eye tracks are a series of coordinates that correspond with where each participant was looking at a particular time. Each track is scaled to roughly 30 coordinates per second of video, so we have a reasonably consistent amount of time between points across all eye tracks. For two tracks, then, our second measure of distance is the average distance between where participants were looking at a given time.
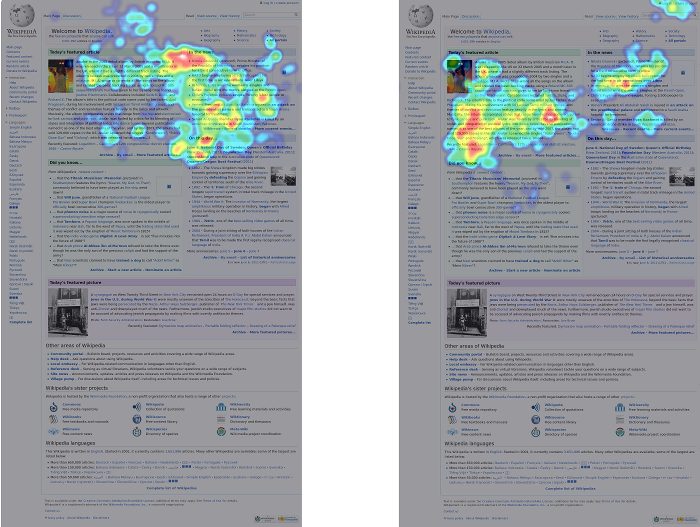
This distance measure works reasonably when the number of coordinates involved is low, but it breaks down when comparing thousand-coordinate tracks. So we use it on the most important set of coordinates: those that correspond with the user’s first few seconds on the site. The heatmaps below show the participants in the same Wikipedia study clustered using the first 300 coordinates (10 seconds) of their gaze tracks.
The distinction is pretty clear: participants in the first cluster looked at the right text box first, while participants in the second cluster look at the left box first.
This may seem like a minor finding, but get this: the clusters generated by this distance metric and the box-counting metric above are identical. In other words, the people who looked at the “Featured Article” box first tended to stay in that area of the page, while the people who looked at “In The News” tended to then move on and look all over the page.
There’s no way to tell why this grouping happened. However, the fact that it persisted across multiple measures of similarity suggests that there really is something going on in these clusters. It also suggests that if we want to give our customers useful information about how people look at their websites, these four heatmaps might be sufficient on their own.
And that’s what this is all about: finding the clearest, most concise way to communicate our findings to customers.
Next week, we’ll be examining how a person’s gaze changes based on whether or not they have seen a site before. The target of the study will be another popular site — reddit.com.


